
|
|
Exam-Style Questions on Velocity Time GraphProblems on Velocity Time Graph adapted from questions set in previous Mathematics exams. |
1. | IB Analysis and Approaches [756] |
A particle moves in a straight line such that it passes through a fixed point \(O\) at time \(t = 0\), where \(t\) represents time measured in seconds after passing \(O\). For \(0 \le t \le 10\) its velocity, \(v\) metres per second, is given by:
$$v = 3\cos(0.7t) + 0.5t - 2.5$$
The graph of \(v\) is shown in the following diagram.
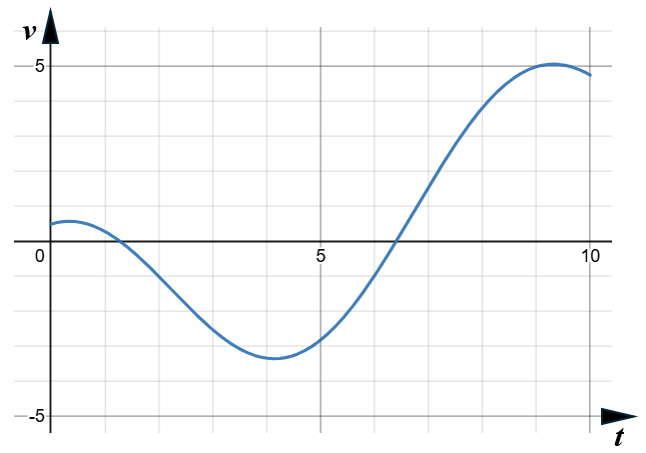
(a) Find the smallest value of \(t\) when the particle changes direction.
The displacement of the particle is measured in metres from \(O\).
(b) Find the range of values of \(t\) for which the displacement of the particle is increasing.
(c) Find the displacement of the particle relative to \(O\) when \(t = 10\).
If you would like space on the right of the question to write out the solution try this Thinning Feature. It will collapse the text into the left half of your screen but large diagrams will remain unchanged.
The exam-style questions appearing on this site are based on those set in previous examinations (or sample assessment papers for future examinations) by the major examination boards. The wording, diagrams and figures used in these questions have been changed from the originals so that students can have fresh, relevant problem solving practice even if they have previously worked through the related exam paper.
The solutions to the questions on this website are only available to those who have a Transum Subscription.
Exam-Style Questions Main Page
To search the entire Transum website use the search box in the grey area below.
Do you have any comments about these exam-style questions? It is always useful to receive feedback and helps make this free resource even more useful for those learning Mathematics anywhere in the world. Click here to enter your comments.