Here are some specific activities, investigations or visual aids we have picked out. Click anywhere in the grey area to access the resource.
 Graph Paper Flexible graph paper which can be printed or projected onto a white board as an effective visual aid.
 Cartoon Scatter Graph Place the cartoon characters on the scatter graph according to their height and age.
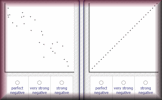 Estimating Correlation Practise the skill of estimating the correlation of data on a scatter graph in this self marking exercise.
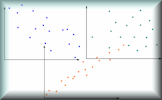 Correlation Arrange the given statements in groups to show the type of correlation they have.
 Human Scatter Graphs Pupils move to positions in the room according to their data relative to the walls as axes.
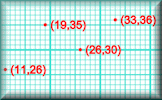 Plotting Scatter Graphs Plot scatter graphs from data representing a number of different everyday situations.
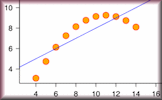 Odd Scatter Out Just by looking at the scatter graphs can you decide which is the odd one out according to their summary statistics?
Here are some exam-style questions on this statement:
- "Ben measured the length and the width of each of 10 sea shells of the same type. The results are shown below." ... more
- "The number of visitors to a cycle track and the number of drinks sold by a café at the location are recorded in the table below." ... more
- "The scatter graph shows the maximum temperature (oC) and the number of bowls of soup sold at a sandwich shop on twelve randomly selected days last year." ... more
- "In the Bubbleless Bandits free-diving club, members practice breath-holding techniques as part of their routine." ... more
- "The scatter graph gives information about the marks earned in a Statistic exam and a Mathematics exam by each of 13 students." ... more
- "Ten students are given a test on calculus and a test on probability. Each test is scored out of a total of 100 marks. The scores of the students are shown in the following table:" ... more
- "In a survey of insect life near a stream, a student collected data about the number of different insect species \((y)\) that were found at different distances \((x)\) in metres from the stream." ... more
- "The table below shows the scores for 12 students on two Mathematic exam papers. For the first paper calculators were allowed and for the second paper they were not." ... more
Click on a topic below for suggested lesson Starters, resources and activities from Transum.
How do you teach this topic? Do you have any tips or suggestions for other teachers? It is always useful to receive feedback and helps make these free resources even more useful for Maths teachers anywhere in the world. Click here to enter your comments.

