Describe the distance time graphs below
Describe the distance time graphs below
|
Recently UpdatedMeasuring Angles Measure the size of the given angles to within two degrees of their actual value. So far this activity has been accessed 79282 times and 49725 Transum Trophies have been awarded for completing it. |
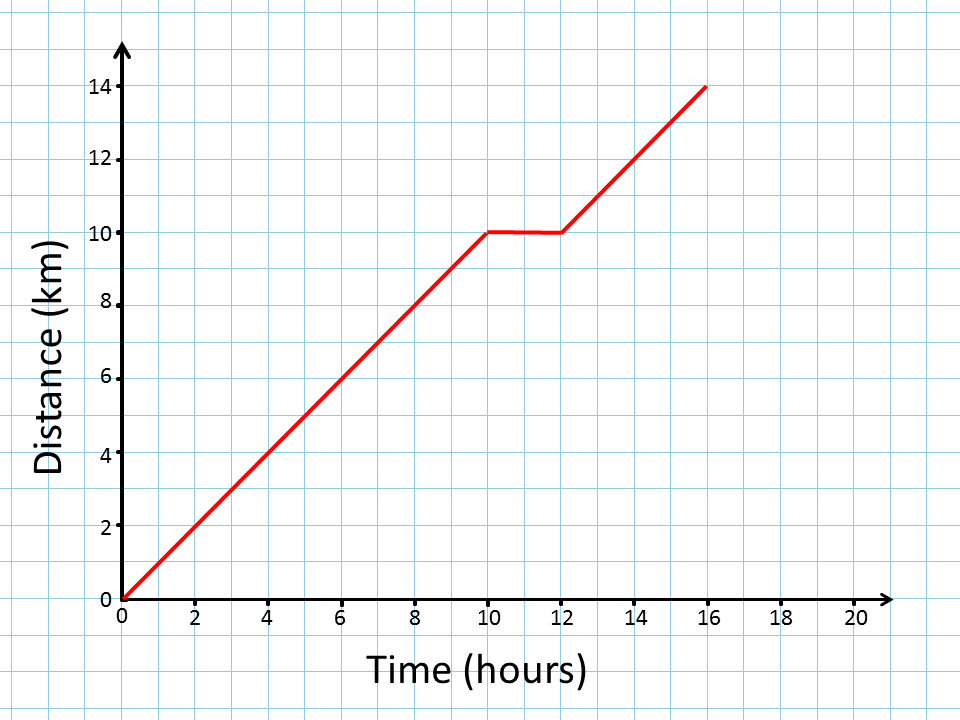
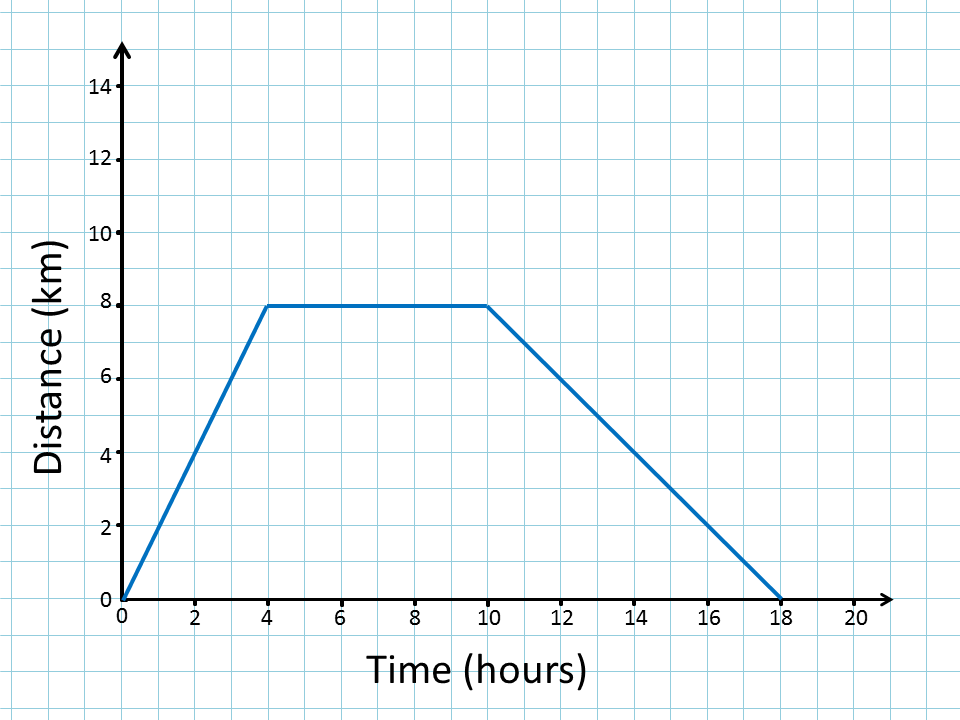
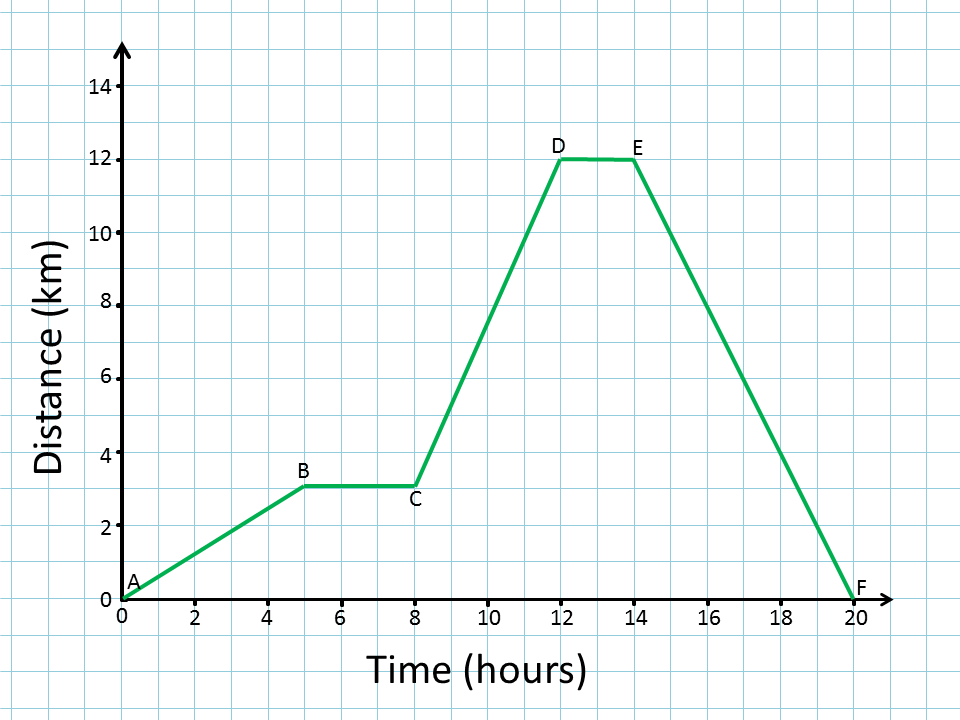
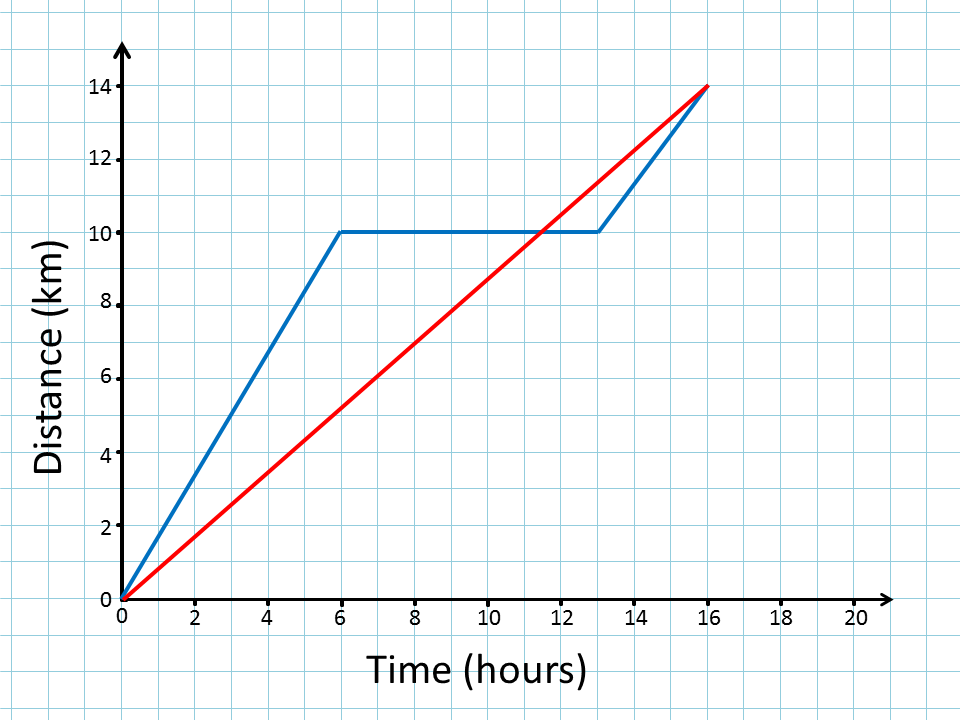
Distance Time GraphsA visual aid for a teacher to use in a Mathematics lesson showing distance time graphs.Class discussion might illuminate the fact that the steepness or gradient of the line graph is related to the speed of the vehicle. A positive gradient indicates a velocity away from the reference point while a negative gradient represents a velocity in the opposite direction. A gradient of zero represents the vehicle coming to rest. In the real world a more accurate graph of the situation would be a smooth curve rather than a number of straight lines. After viewing the graphs above have a look at the Hurdles Race for some fun. Finally here is the multi-level Travel Graphs interactive set of exercises. |
|
|
Do you have any comments? It is always useful to receive feedback and helps make this free resource even more useful for those learning Mathematics anywhere in the world. Click here to enter your comments. |
||