Probability Starters:
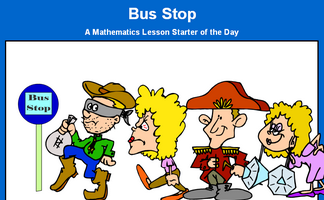
How many different ways can four people stand in line?
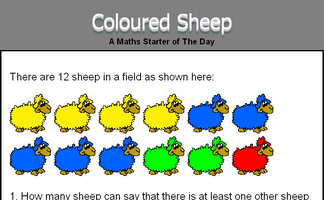
What is the probability of picking a red sheep from the sheep in the field?
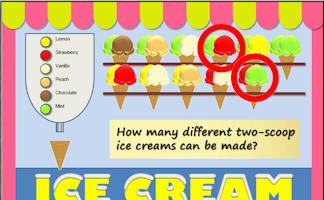
How many different ice cream cones can be made by choosing two scoops from six flavours?
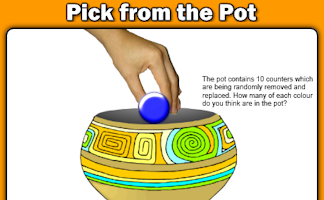
The pot contains 10 counters which are being randomly removed and replaced. How many of each colour do you think are in the pot?
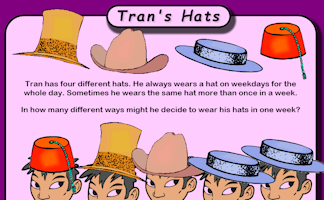
In how many different ways might Tran decide to wear his hats in one week?
Advanced Probability Starters
Exercises
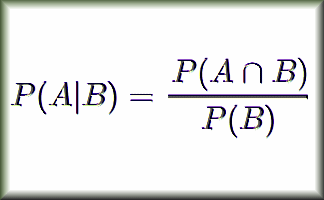
Conditional Probability
Find the probability of one event happening given that another event has already happened.
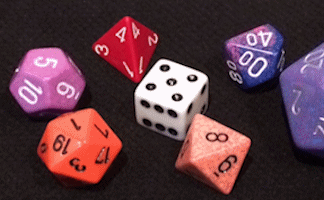
Dice and Spinners
Computer generated random numbers for games and probability experiments
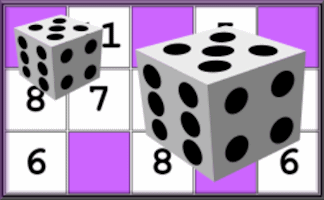
Dice Bingo
Choose your own numbers for your bingo card. The caller uses two dice and adds the numbers together.
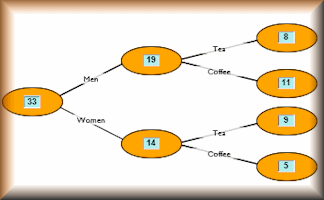
Frequency Trees
Use a frequency tree to show two or more events and the number of times they occurred.
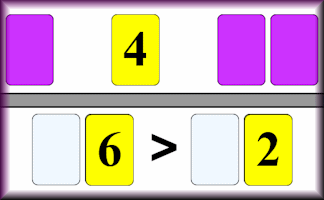
Great Expectation
An interactive online activity requiring logical thinking and a certain amount of luck to place the digits on the correct side of the inequality sign.
Greater Than
The teacher is in charge of the order in which the numbered cards are revealed. Pupils have to decide where to put them!
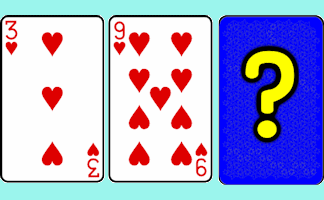
Hi-Low Predictions
A version of the Play Your Cards Right TV show. Calculate the probabilities of cards being higher or lower.
Likelihood
Arrange some statements in order according to the probability of them happening. Compare your opinion with thousands of others.
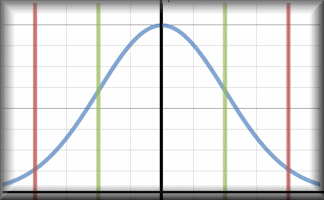
Normal Distribution Calculator
A customised online calculator for quickly finding areas under the normal distribution curve.
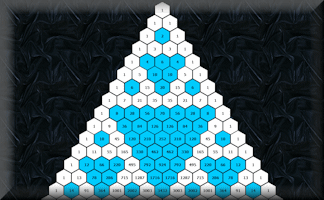
Pascal's Triangle
Get to know this famous number pattern with some revealing learning activities
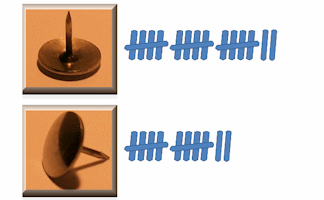
Pin Drop
Estimate the probability of a drawing pin landing point up from experimental data.
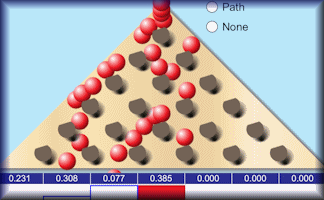
Plinko Probability
A simulation of a Quincunx (Galton Board) which can be used to create the bell shaped curve of the normal distribution.
Probability
Basic probability questions in an online exercise.
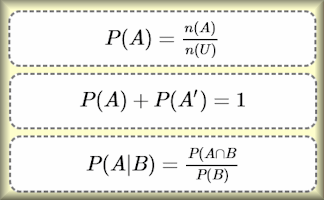
Probability Formulae
Show that you know which formula (as given in the IB Formula Booklet) to use for each probability question. A drag and drop challenge.
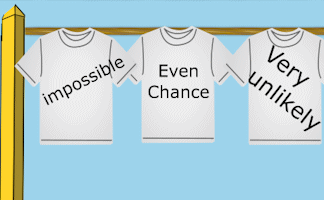
Probability Washing Line
Hang out the washing on the line so that the probability words on the t-shirts are in order.
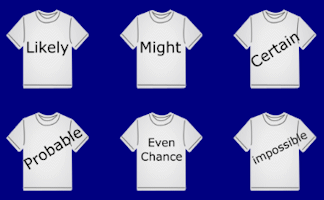
Probability Words
A visual aid to highlight the vocabulary of probability and to debate the relationship between the given words.
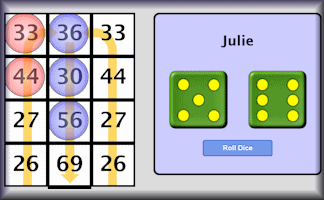
Remainder Race
A game involving chance and choice requiring an ability to calculate the remainder when a two digit number is divided by a single digit number.
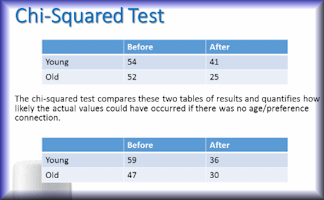
Significance
A slide presentation showing how to use the chi-squared test to measure significance.
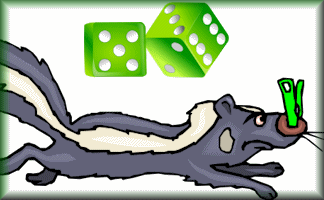
Skunk
A game for the whole Maths class to play involving chance and choice.
Snail Race
A race between 12 snails. Which snail is most likely to win? This is the students' version of the race simulation.
Snail Race Projectable
Twelve snails have a race based on the sum of two dice. This is the teachers' version of the race simulation.
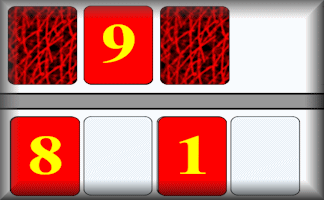
Superior
A game for two players who compete to make the largest possible number from randomly selected cards.
t-Test Revision
A slide presentation designed to revise the key aspects of Student's t-Test.
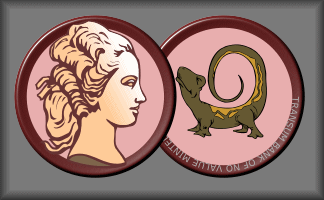
The Maths of Gambling
Gambling is never a good idea and this activity might help you understand the mathematics involved.
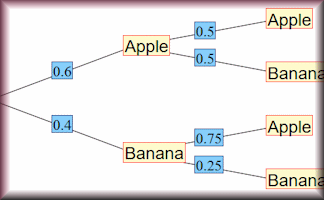
Tree Diagram Creator
Quickly create a probability tree diagram to use as a visual aid.
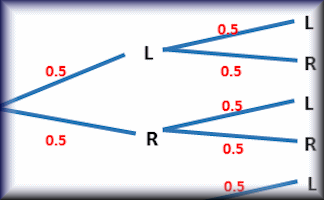
Tree Diagrams
Calculate the probability of independent and dependent combined events using tree diagrams.
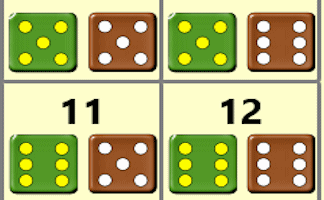
Two Dice Possibility Space
An interactive visual aid showing the possibility space obtained when throwing two dice
Other activities for this topic | | |
Complete Index of Starters
Search
The activity you are looking for may have been classified in a different way from the way you were expecting. You can search the whole of Transum Maths by using the box below.
Have today's Starter of the Day as your default homepage. Copy the URL below then select
Tools > Internet Options (Internet Explorer) then paste the URL into the homepage field.
Set as your homepage (if you are using Internet Explorer)
Do you have any comments? It is always useful to receive
feedback and helps make this free resource even more useful for those learning Mathematics anywhere in the world.
Click here to enter your comments.


