
 |
Exam-Style Questions.Problems adapted from questions set for previous Mathematics exams. |
1. | GCSE Higher [715] |
(a) The list shows 18 temperatures, in degrees Celsius, at 2pm on different days in Honeyville.
| 19 | 23 | 23 | 16 | 22 | 18 | 29 | 18 | 23 |
| 24 | 16 | 23 | 20 | 25 | 23 | 27 | 27 | 23 |
(i) Construct a stem-and-leaf diagram to show this information.
(ii) Find the median.
(iii) Find the lower quartile.
(iv) Graham draws a pie chart to show this information.
Calculate the sector angle for the number of days the temperature is 23°C.
(b) The box-and-whisker plot shows information about the masses, in grams, of some stones.

(i) Find the median.
(ii) Find the range.
(iii) Find the interquartile range.
(c) (i) The time, \( t \) minutes, spent exercising in one week by each of 184 students is recorded. The table shows the results.
$$ \begin{array}{|c|c|} \hline \text{Time } (t \text{ minutes}) & \text{Frequency} \\ \hline 40 < t \leq 60 & 5 \\ 60 < t \leq 80 & 12 \\ 80 < t \leq 90 & 55 \\ 90 < t \leq 100 & 90 \\ 100 < t \leq 150 & 22 \\ \hline \end{array} $$Calculate an estimate of the mean.
(ii) A new table with different class intervals is completed.
$$ \begin{array}{|c|c|} \hline \text{Time } (t \text{ minutes}) & \text{Frequency} \\ \hline 40 < t \leq 90 & 72 \\ 90 < t \leq 150 & 112 \\ \hline \end{array} $$On a histogram the height of the bar for the \( 40 < t \leq 90 \) interval is 7.2 cm.
Calculate the height of the bar for the \( 90 < t \leq 150 \) interval.
2. | GCSE Higher [282] |

The box plot shows information about the distribution of the times (in minutes) groups of customers spend in a open-air restaurant.
(a) Calculate the interquartile range for the amount of time groups spend in this open-air restaurant.
The table below shows information about the distribution of the times (in minutes) groups of customers spend in an indoor restaurant.
| Minimum | Lower Quartile | Median | Upper quartile | Maximum | |
| Time in minutes | 30 | 45 | 62 | 82 | 94 |
(b) On the lower half of the grid above, draw a box plot for the information in the table.
(c) Hunter thinks that the total amount of time spend by all of the customers visiting the indoor restaurant is greater than the total amount of time spend by all of the customers visiting the open-air restaurant. Is Hunter correct? Explain your decision.
3. | GCSE Higher [794] |
The range, mode, median and mean of five positive integers are all equal to 8. Find two different possible sets of these five integers.
4. | GCSE Higher [595] |
Kevin recorded the heights, in centimetres, of some cows.
| Minimum height | 104cm |
| Lower quartile | 121cm |
| Interquartile range | 23cm |
| Median | 128cm |
| Range | 67cm |
Draw a box plot to show this information.
5. | GCSE Higher [135] |
The scatter graph gives information about the marks earned in a Statistic exam and a Mathematics exam by each of 13 students.
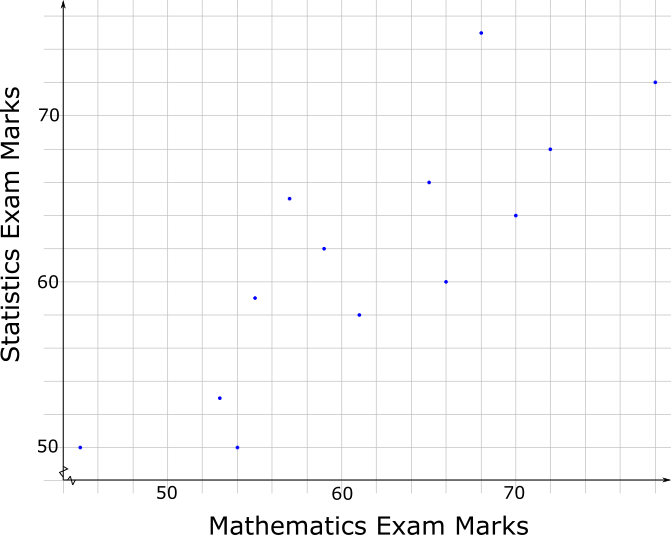
The box plot for the Mathematics exam for the 13 students is drawn on the grid below.
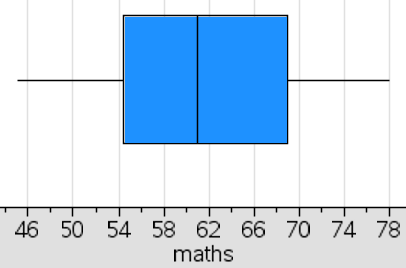
(a) Draw the box plot for the Statistics exam.
(b) Compare the distributions of marks scored in the two exams.
6. | GCSE Higher [404] |
Here is some information about the length of time children spent in a swimming pool at a holiday resort during a heat wave.
Draw a box plot to show this information.
7. | GCSE Higher [173] |
One day a theme park monitored the time spent by guests at six different areas of the park. The times are recorded in the box plots below.
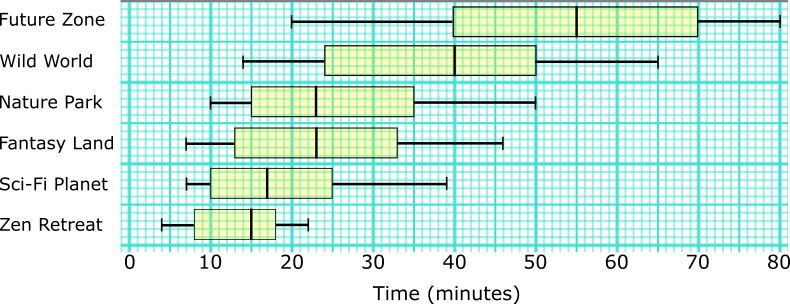
(a) Work out the range in times at Future Zone.
(b) At which area were visitor times the most consistent? Give a reason for your answer.
(c) Give one similarity and one difference between the distributions of the guest visiting times for Nature Park and Fantasy Land.
(d) Is it possible to work out from the box plots which area had the most visitors? Explain your answer.
8. | IB Studies [92] |

The distribution of daily average wind speed on an island over a period of 120 days is displayed on this box-and-whisker diagram.
(a) Write down the median wind speed.
(b) Write down the minimum wind speed.
(c) Find the interquartile range.
(d) Write down the number of days the wind speed was between 20 kmh-1 and 51 kmh-1.
(e) Write down the number of days the wind speed was between 9 kmh-1 and 68 kmh-1.
9. | IB Applications and Interpretation [419] |
Derek has put together a fantasy football squad and has recorded the heights of all the players in the squad rounded to the nearest centimetre. The data is illustrated in the following box and whisker diagram.

(a) Write down the median height of the players.
(b) Write down the upper quartile height.
(c) Find the interquartile range of the heights.
The height of these players are normally distributed.
(d) Find the height of the tallest possible player that is not an outlier. Give your answer to the nearest centimetre.
10. | GCSE Higher [185] |
The charts below show the results of pupils in a Year Group answering twenty mental arithmetic questions.
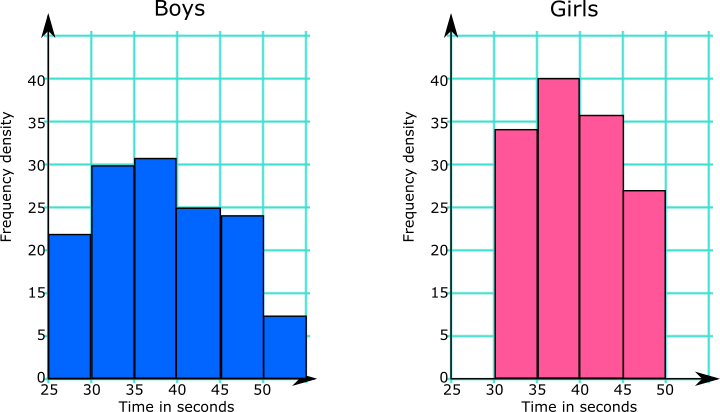
What information from the diagrams can be used to support or counter each of these statements?
(a) Girls are better at mental arithmetic than boys.
(b) The range of the boys' times is greater than the range of the girls' times.
The Head of the school would like to use this data to make statements about all of the pupils in the school.
(c) Comment on whether any conclusions can be drawn for the whole school population from the results of this Year Group.
11. | GCSE Higher [496] |
Poppy Pringle recorded the heights in centimetres of the sunflowers growing in her brother's and sister's gardens.

Here are the heights of the 19 sunflowers in her brother's garden:
$$94, 103, 110, 111, 123, 143, 150, 150, 151, 156, 157, 160, 170, 182, 201, 220, 250, 255, 261$$(a) Complete the table below to show information about this data.
| Median | |
| Lower quartile | |
| Upper quartile | |
| Shortest | |
| Tallest |
Here is some information about the sunflowers in Poppy's sister's garden:
| Median | 160 |
| Lower quartile | 143 |
| Upper quartile | 172 |
| Shortest | 110 |
| Tallest | 199 |
Poppy says that the sunflowers in her brother's garden are shorter that those in her sister's garden.
(b) Is Poppy correct?
You must give a reason for your answer.
Poppy says that the sunflowers in her brother's garden vary more in height than those in her sister's garden.
(c) Is Poppy correct?
You must give a reason for your answer.
12. | IB Analysis and Approaches [555] |
A number of organically-grown carrots were measured (in centimetres) and the results recorded. The following box and whisker diagram shows a summary of the results where L and U are the lower and upper quartiles respectively. The diagram is not drawn to scale.
The interquartile range is 8cm and there are no outliers in the results.

Find the maximum possible value of L.
Hence, find the maximum possible value of U.
If you would like space on the right of the question to write out the solution try this Thinning Feature. It will collapse the text into the left half of your screen but large diagrams will remain unchanged.
The exam-style questions appearing on this site are based on those set in previous examinations (or sample assessment papers for future examinations) by the major examination boards. The wording, diagrams and figures used in these questions have been changed from the originals so that students can have fresh, relevant problem solving practice even if they have previously worked through the related exam paper.
The solutions to the questions on this website are only available to those who have a Transum Subscription.
Exam-Style Questions Main Page
To search the entire Transum website use the search box in the grey area below.
Do you have any comments about these exam-style questions? It is always useful to receive feedback and helps make this free resource even more useful for those learning Mathematics anywhere in the world. Click here to enter your comments.