Here are some specific activities, investigations or visual aids we have picked out. Click anywhere in the grey area to access the resource.
 Averages Video Revise how to calculate the mean, median, mode and range from lists and frequency tables.
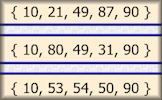
 Averages Test your understanding of averages with this self marking quiz about mean, median and range.
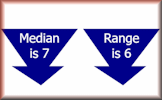
 Choose Your Average This is a game for two players. You should know how to find the mean, median and range of a set of numbers.
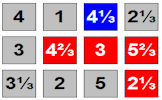
 StatGrid Challenge Arrange the numbers one to nine in a three by three grid to obtain the given means, medians and ranges.
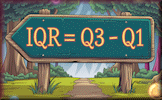
 Quartiles Practise processing the sets of numbers to find the lower and upper quartiles.
 Standard Deviation Find how 'spread out' data is by estimating and calculating this measure of dispersion.
Here are some exam-style questions on this statement:
- "The table shows information about the heights of 85 stalagmites." ... more
- "The height, \(h\) cm, of each of 100 standing meerkats is measured. The table shows the results." ... more
- "The following table shows the time taken by fifty people to answer their emails one day." ... more
- "The table shows the amount of time, in months, taken to sell houses on the Happyland housing estate." ... more
- "Jayne rolls a six-sided die 25 times." ... more
- "The times taken in seconds by a group of students to complete an online exercise are listed as follows." ... more
- "The personal trainer collected data from a randomly selected sample of days. From this he found that the number glasses of water he drank in a day had a mean of 4.35. " ... more
- "This cumulative frequency graph shows the speeds in kmh-1 of cyclists passing a certain point on a race track." ... more
- "A data set has \(n\) items. The sum of the items is 650, the mean is 13 and the standard deviation is 5." ... more
Click on a topic below for suggested lesson Starters, resources and activities from Transum.
- Averages "Average" is a very general term that is used commonly in everyday English and most people have an idea what it means. Mathematicians like to be a little more precise however and have come up with a number of different ways of finding a measure of central tendency. Pupils at school should develop their understanding of averages so that they can more precisely communicate information to others and are not misled by statistics presented in a way to distort the facts. Pupils should understand and use the mean of discrete data. They should be able to compare two simple distributions using the range and one of the mode, median or mean. See also the topics called Data Handling and Statistics.
- Statistics Statistics is the study of the collection, organisation, analysis, interpretation and presentation of data. It deals with all aspects of data, including the planning of data collection in terms of the design of surveys and experiments. It also includes describing mathematical relationships between variables and presenting these to an audience in a way that best conveys meaning. See also the topics called Data Handling, Probability and Averages.
Furthermore
This Bicen Maths video clip shows everything you need to memorise on Measures of Spread for A Level Maths.
If you use a TI-Nspire GDC there are instructions for calculating statistics from a list which is useful for this topic.
Some of the key formulae related to central tendency and dispersion:
$$ \text{Population Mean} (\mu) = \frac{\sum_{i=1}^{N} x_i}{N} \\ \text{Sample Mean} (\bar{x}) = \frac{\sum_{i=1}^{n} x_i}{n} $$The syllabus says calculation of standard deviation and variance of the sample using only technology is required, however hand calculations may enhance understanding. So here are the formulas to enhance understanding but not required for the exam.
| Symbol | Meaning | Formula | When to use |
|---|---|---|---|
| \(\sigma\) | Population standard deviation | \(\displaystyle \sigma=\sqrt{\frac{\sum_{i=1}^{N}(x_i-\mu)^2}{N}}\) | When you have data for the entire population. |
| \(s\) | Sample standard deviation | \(\displaystyle s=\sqrt{\frac{\sum_{i=1}^{n}(x_i-\bar{x})^2}{\,n-1\,}}\) | When you have a sample and are estimating the population spread (uses Bessel’s correction). |
There are actually four different methods for calculating the quartiles of a data set. These are explained on the Wikipedia page on quartiles. For discrete data, it turns out that there is no universal agreement on how to determine quartile values.
For example, consider the ordered data set: 6, 7, 15, 36, 39, 40, 41, 42, 43, 47, 49.
Here are the lower quartiles calculated using four different methods:
| Method | Lower Quartile |
|---|---|
| Method 1 | 15 |
| Method 2 | 25.5 |
| Method 3 | 20.25 |
| Method 4 | 15 |
This variation in results highlights the nuances in statistical definitions that we often overlook. It's fascinating (and humbling) to realise that even concepts we thought were straightforward can be approached in multiple ways, depending on the methodology used.
This video on Mean, Standard Deviation and Variance is from Revision Village and is aimed at students taking the IB Maths AA SL/HL level courses.
How do you teach this topic? Do you have any tips or suggestions for other teachers? It is always useful to receive feedback and helps make these free resources even more useful for Maths teachers anywhere in the world. Click here to enter your comments.

